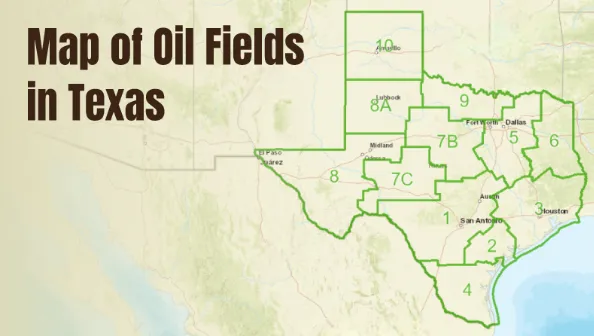
According to data from the Railroad Commission of Texas (2021), Texas is the oil powerhouse of the United States, with approximately 554,596 active and licensed wells dispersed throughout the state.
The crown jewel of Texas oil output is the Permian Basin alone, which pumps an astounding 4.2 million barrels per day. You may now investigate real-time well locations, production numbers, and geological insights like never before, thanks to sophisticated digital mapping tools.
Each of the major regions—such as the Barnett Shale, Eagle Ford Shale, and Permian Basin—tells a unique tale of opportunity, investment, and energy. This informative blog will explain all the essential aspects of the map of oil fields in Texas.
Overview of Texas Oil Field Maps
The largest producer of oil in the U.S. is Texas, which produces approximately 4 million barrels per day in hundreds of thousands of wells located in all 254 counties. This energy landscape can be better understood by the map of oil fields in Texas, which includes the data of the Railroad Commission as well as the geological survey.
They show the active production wells, injection wells, and permit statuses in these maps, providing a clear picture of Texas oil infrastructure. Production volumes, the date of completion and operational status are displayed in real time and therefore, they are important to investors, operators and planners. The limits of the counties can be used to systematize the data and show the tendencies in high-density drilling locations.
The use of modern maps enables users to zoom in and out of maps from the state level all the way to the individual wells. This flexibility guarantees that the regional analysts as well as site-specific planners will be able to get the accurate data required.
Major Oil-Producing Regions in Texas
Texas oil production is concentrated in specific geological areas with unique characteristics. These regions include both conventional and unconventional resources, providing a variety of investment opportunities.
Permian Basin
The Permian Basin spans 86,000 square miles across West Texas and southeastern New Mexico, producing 4.2 million barrels daily. Key sub-regions include the Midland and the Delaware Basins, where deep, complex formations allow both horizontal and conventional drilling.
- Counties:
Midland, Reeves, Loving, Andrews, Upton
- Technology:
Hydraulic fracturing and multi-zone horizontal wells
The Permian accounts for about 40% of Texas oil output. Advanced techniques extend field life and unlock previously uneconomical formations.
Eagle Ford Shale
Stretching from South to East Texas, the Eagle Ford Shale transformed rural communities with horizontal drilling and hydraulic fracturing.
- Key Counties:
Karnes, DeWitt, Gonzales, McMullen
- Production:
Oil, condensate, and natural gas
Mapping these areas helps operators balance production efficiency with environmental concerns, supporting local economies and sustainable development.
Barnett Shale
Located in North Texas, including the Dallas-Fort Worth Metroplex, the Barnett Shale is mainly known for natural gas but also produces oil and condensate.
- Urban Advantages:
Infrastructure, skilled workforce, transport access
- Challenges:
Regulatory oversight and community engagement
In this landscape of diverse basins and evolving activity, Mineral View helps users visualize these regions clearly—offering real-time insights into wells, permits, and production trends across all major Texas oil plays.
Key Geological Formations on Texas Maps
Understanding formations on the map of oil fields in Texas is essential for optimizing drilling strategies.
- Wolfcamp Shale:
Most productive in the Permian, producing over 1 million barrels/day. Ideal for horizontal drilling and hydraulic fracturing.
- Bone Spring Formation:
The Delaware Basin formation produces 650,000 barrels/day, featuring limestone and sandstone layers requiring advanced completion methods.
Mapping layers let users analyze multiple geological horizons simultaneously, which is critical for maximizing resource recovery.
Accessing Texas Oil Field Maps
Data is accessible via several platforms:
- Texas Oil and Gas Viewer:
Official Railroad Commission resource
- Fractracker Alliance:
Visualizations by well type, date, and production status
- Commercial Platforms:
Offer forecasting, analytics, and proprietary tools
Maps provide adjustable displays, API access, and export options for research or monitoring, ensuring flexibility for all stakeholders.
Understanding Map Data and Symbols
Maps use standard codes to indicate well types and operational status:
- Production wells, injection wells, water wells, and other wells
- Indicators:
Active, permitted, plugged, or abandoned
- Infrastructure Overlays:
Pipelines, processing facilities, transport networks
- Environmental Markers:
Spill sites, remediation areas, sensitive zones
This coding ensures accurate interpretation for investors, operators, and regulators.
Historical Development and Production Trends
Spindletop, which produced a total of more than 28.9 billion barrels, marked the beginning of Texas oil history in 1901. Conventional reservoirs predominated at first, but shale formations were unlocked by contemporary horizontal drilling and fracturing, which caused production to shift to unconventional sources like Wolfcamp and Eagle Ford.
Drilling activity is still influenced by economic cycles, with downturns emphasizing efficient operations and high oil prices promoting rapid development. These tendencies can be seen on a map of Texas oil fields.
Stakeholder Applications of Texas Oil Field Maps
- Landowners:
Negotiate leases using nearby production and formation data
- Investors:
Analyze geological risk and production potential for energy portfolios
- Operators:
Optimize field development, supply chains, and regulatory compliance
Modern GIS-based platforms offer mobile apps, cloud collaboration, machine learning analytics, and API integration for real-time access and strategic planning.
Environmental and Regulatory Mapping Layers
Maps integrate environmental data to support responsible development:
- Air & Water Monitoring: Track emissions and groundwater protection
- Wildlife Habitats: Ensure drilling does not harm sensitive areas
- Seismic & Pipeline Safety: Monitor injection wells and infrastructure
These overlays help stakeholders balance production efficiency with ecological and regulatory compliance.
Conclusion
The map of oil fields in Texas is more than just a visual tool—it’s a vital resource for investors, operators, landowners, and regulators.
By providing insights into well locations, production trends, geological formations, and environmental factors, these maps enable informed decision-making in one of the world’s most prolific oil-producing states.
FAQ
How often is the Texas Oil Field Map Data updated?
The Railroad Commission of Texas updates data continuously, with major refreshes monthly. New wells and status changes are added regularly for accuracy.
Can I Access Historical Production Data for Specific Wells on Texas Oil Field Maps?
Yes, most platforms provide decades of historical production data, including monthly volumes, cumulative totals, and operational changes.
What’s the Difference between Active and Permitted Wells shown on Texas Oil Maps?
Active wells are producing oil or gas, while permitted wells are approved but may not yet be drilled. Plugged and abandoned wells are also shown.
Are there Restrictions on Accessing Detailed Texas Oil Field Mapping Data?
Basic well location and production data is public, but some commercial tools require subscriptions for advanced features and real-time updates.
How Accurate are the Geological Formation Boundaries shown on Texas Oil Field Maps?
Boundaries are based on detailed geological surveys and well logs. Major formations like the Wolfcamp and Bone Spring are accurately represented, though subsurface variations exist.

I’m Leo Knox, the wordplay wizard behind WordsTwists.com where I turn everyday meanings into funny, clever, and creative twists. If you’re tired of saying things the boring way, I’ve got a better (and funnier) one for you!